+ Admin access to your phone system, VoIP dashboard, or carrier portal
+ One month of call detail records you can export to a spreadsheet
+ Your practice management system's new-patient count for the same month
+ Roughly two to three uninterrupted hours
What you will end up with
+ A written range, not a point estimate, for what unanswered calls cost your practice in a month.
+ A split of those calls into staffed hours, coverage gaps, and unstaffed hours, since the fix differs for each.
+ A repeat-caller ratio, which is the correction most vendor estimates leave out.
+ A patient value drawn from your own records rather than an industry benchmark.
+ A dated one-page record of every assumption, so the number can be checked and re-run later.
Every vendor in this category will happily tell you what your missed calls are worth. None of them has seen your phone log. This is how to produce the number yourself, in an afternoon, from records you already have.
partner one
partner two
the evidence, so far
One afternoon of call records ends this permanently, whichever way it comes out.
There is a specific conversation that happens in practices about twice a year. Someone says the phone is a problem. Someone else says it is not that bad. Nobody has a number, so the argument is settled by whoever sounds most certain, and six months later it happens again.
This guide ends that. It takes one month of your own call records and turns them into a range you can put in front of a partner, a spouse, or a vendor, with every assumption written down beside it. It takes an afternoon. It needs no new software, and it does not need anyone's permission.
The honest warning up front: a meaningful minority of practices do this and find the number is small. That is a good outcome. It costs you an afternoon and saves you a subscription, and it is the reason to measure rather than to guess in either direction.
The thing you want is not a count of missed calls. It is an estimate of revenue that did not arrive because a call was not answered, which is a different and smaller quantity. Most of the alarming figures in this category quietly conflate the two, and the gap between them is where credibility lives.
Four numbers get you there. How many calls went unanswered, how many of those were distinct people rather than the same person trying three times, what share of a first-time caller becomes a patient, and what a patient is worth. Multiply the four, present it as a range, and you have something defensible.
Everything below is one of those four numbers or a correction to one. The corrections matter more than the multiplication does, because the multiplication is arithmetic and the corrections are where an honest estimate separates from a scary one.
The order matters too. Each lesson makes the number smaller and the number harder to argue with, which feels like the wrong direction while you are doing it and is the entire point. A figure that survives 9 deliberate attempts to shrink it is a figure you can take to someone who does not want to hear it.
A count of missed calls is not a revenue figure. Treating it as one is the single most common error in this category.
Every phone system worth having can export call detail records. What you are looking for is one row per call with a timestamp, a direction, a duration, and a disposition. The names differ by vendor and the data does not.
Log into your phone system, VoIP dashboard, or carrier portal as an admin.
Find the section called Call Detail Records, Call History, Call Logs, or Analytics.
Set the range to one full calendar month, ideally the most recent complete one.
Filter to inbound only. Outbound calls are a different question and will distort everything downstream.
Export to CSV and open it in a spreadsheet.
Pick a month that was ordinary. A month containing a holiday closure, a system migration, or two weeks of staff sickness will give you a number, but it will be a number about that month rather than about your practice.
If your system genuinely cannot export, you can do this by hand from a month of on-screen logs in about 1 hour, and it is still worth doing. What you cannot do is skip to the multiplication with a figure someone remembers.
Two data-quality checks are worth 5 minutes before you go further. First, confirm the row count roughly matches what your system reports as total inbound volume for the month, because a filtered export that quietly capped at 1,000 rows will understate everything downstream. Second, check that the timestamps are in your local time zone rather than UTC, since a 5-hour or 6-hour offset will move a large block of evening calls into the staffed bucket and make your gap look far smaller than it is.
That second one is not hypothetical. Time-zone drift in exported call records is common enough that it is worth spot-checking 3 or 4 rows against calls you remember taking.
The single most useful cut in the whole exercise is the one almost no phone report gives you by default: whether anybody was in the building when the call arrived. Add one column and sort on it.
Build a small table of your actual opening hours, then classify every row against it:
Bucket
Definition
Why it is separate
Staffed
Inside opening hours, desk covered
A miss here is usually a delay, and often recovers on its own
Lunch and gaps
Inside opening hours, desk not covered
Behaves like unstaffed, but is fixable by rota alone
Unstaffed
Outside opening hours, including weekends
A miss here often gets no second attempt at all
The reason to separate the middle row is that it is the cheapest thing on this list to fix, and a practice that discovers most of its misses happen between 12:30 and 1:30 has learned something more useful than a total. Fix the rota before buying anything.
A standard schedule of 8 hours a day, 5 days a week covers 40 hours out of the 168 hours in a week, leaving 128 hours uncovered. That ratio is structural rather than a scheduling failure, and the reasons it behaves so differently from the staffed hours are worked through in why after-hours calls are different.
Fix the rota gaps before you price anything. They are the only bucket on this list that costs nothing to close.
Sort the unstaffed bucket by hour of day before you leave this lesson. Most practices find their evening volume concentrated in a narrow window, often the 2 hours after close rather than spread evenly across the night, and that shape matters later when you are deciding what coverage is actually worth buying. A gap that is really 10 hours a week of concentrated demand is a different proposition from 128 hours of thin, even trickle.
The staffed week
Staffed40 hrs
Unstaffed128 hrs
Lesson 2 splits your month against this shape. The middle bucket is the cheap fix.
Your phone system's "missed" column is doing more work than it admits. At least four different events usually hide inside it, and only some of them represent lost demand.
Disposition
What happened
Counts as a miss
Rang out
Caller heard ringing, nobody picked up, no voicemail
Yes, this is the core case
Abandoned in queue
Caller reached a hold queue and hung up
Yes, but the fix is hold time, not coverage
Voicemail left
Caller told you what they wanted
No, this is a task with a deadline
Under 10 seconds
Misdial, wrong number, hang-up before connect
No, drop these rows entirely
Drop the last row entirely and count voicemails separately, because a voicemail is a task rather than a loss. Whether it becomes a loss depends on your callback discipline, which is worth measuring on its own but is not what this afternoon is for.
The abandoned-in-queue row deserves a second look before you move on. If a large share of your misses sit there, the problem is not that nobody was in the building, it is that the people in the building could not get to the phone fast enough. That is a capacity or a routing problem, and covering your evenings will do nothing for it.
A practical threshold: if more than 30% of your misses are abandoned-in-queue during staffed hours, stop this exercise and go look at your hold times first. You will learn more in 20 minutes there than in the remaining 5 lessons here.
That 30% is a rule of thumb rather than a standard. For an external yardstick, a 2022 study of 6 Veterans Affairs medical centres selected for above-average primary care access records the targets those sites were held to: an average speed of answer of 30 seconds or less, and call abandonment under 5% [1]. A staffed call centre working to a mandate is not a fair comparison for a practice with 2 people on the desk. It does tell you which direction good lies in, and a practice sitting at 25% abandoned during staffed hours is not close to it.
A voicemail is not a missed opportunity. It is an opportunity with a deadline attached.
What remains, rang-out plus abandoned, is your real missed-call count for the month. In most practices this is materially smaller than the number the phone system reports, and being able to say so is what makes the final figure survive scrutiny.
This is the correction that separates an honest estimate from a vendor stat sheet, and it is also the one most often skipped, because it always makes the number smaller.
Sort your remaining missed calls by caller number.
Group calls from the same number within a 48-hour window into one attempt.
Count the distinct numbers rather than the rows.
Note the ratio of rows to distinct numbers, and write it down.
That ratio is worth keeping. A practice where 300 missed calls collapse into 180 distinct people has a very different problem from one where 300 collapse into 290. The first has a capacity problem during busy periods. The second has a coverage problem, and persistent callers are not what is failing.
There is a subtlety here that cuts the other way. A caller who tried 3 times and then stopped is showing more intent than one who tried once, not less, so a high repeat ratio does not mean the misses matter less. It means fewer people are affected, more severely.
The 48 hours window is a judgement call and you can defend a different one. A caller ringing back 5 days later about the same thing is arguably the same opportunity, and a practice with a long consideration cycle might reasonably use 7 days. What matters is that you pick one, write it down, and apply it consistently, because a ratio computed with a moving window is not a ratio.
One thing worth noting while you have the data sorted: how many distinct numbers appear only in the missed set and never in the answered set across the whole month. Those are the callers you never spoke to at all, and in most practices that count is smaller than the raw missed figure by a wide margin.
Two practices, same missed-call count
Practice A
Practice B
Missed calls in the month
300
300
Distinct callers
180
290
Rows per caller
1.7
1.03
What it suggests
Busy-period capacity
Coverage, and one-shot callers
300 missed calls means different things depending on how many people they came from.
You need a per-patient value, and there are two defensible ways to get one. Pick whichever your records support, and say which one you used.
Method
How to calculate
Use when
First-visit value
Average revenue of a new patient's first appointment
Your records are thin, or first visits vary little
First-year value
Total revenue from new patients in a year, divided by the count
You can pull a year of new-patient revenue
The first-visit method is conservative and easy to defend. The first-year method is more realistic for practices where the first appointment is a consultation that leads to a course of treatment, which describes most of aesthetics and a good deal of dentistry.
Do not use lifetime value here. It is a real concept and it is the wrong tool for this job, because it imports assumptions about retention over several years into a question about one month of phone calls. If you want a number that survives an argument, keep the time horizon short.
Whichever you pick, use your own figure. A national average for your specialty tells you about a distribution you may not sit anywhere near, and a number you pulled from your own practice management system cannot be argued with in the way an industry benchmark can.
None of that is a criticism of the national data. The CDC's National Ambulatory Medical Care Survey is the most careful account there is of what happens in US office-based practices, and it still cannot tell you what a new patient is worth at your address [2]. Specialty, payer mix and the treatments people actually phone about vary too much between practices for any national figure to stand in for your own.
There is one adjustment worth making if your practice has a wide service mix. A first-time caller is not a random draw from your existing patient base, because the treatments people phone about are not the treatments people book once they are already with you. If 60% of your revenue comes from returning patients on a recall cycle, a value averaged across all patients will overstate what a new inbound caller is worth on day 1.
The fix is to compute the value from new patients only, in their first 30 days or their first 12 months depending on which method you chose. It usually moves the number down, and moving it down is the point.
This is the softest of the four numbers and the one to be most careful with, because it is where an estimate turns into a claim. You are asking what share of a first-time caller would have become a patient if the call had been answered.
The best available proxy is your own answered-call conversion. If you can pull the number of new patients booked in the month and the number of distinct first-time callers who got through, the ratio is a reasonable starting point.
Count new patients booked in the month from your practice management system.
Count distinct answered first-time inbound callers for the same month.
Divide the first by the second.
Then discount it, for the reason below.
The discount matters. A caller who got through and a caller who did not are not the same population. The one who got through reached you at a moment when you were available, which correlates with when you are staffed, which correlates with the kind of call it was. Applying your answered rate to your missed calls without a haircut assumes those populations are identical, and they are not.
A reasonable practice is to run the calculation at your measured rate, at two thirds of it, and at one third, and present all three. That is the range, and it is more useful than a single confident number.
One input your own records cannot give you is whether a caller would have accepted an automated booking at all. A 2024 Talkdesk survey of 1,000 US adults put the share comfortable with AI scheduling routine appointments at 42%, and the share of patients with sensitive issues who would rather book through a chatbot than speak to someone at 67% [3]. That survey was paid for by a company selling contact centre software, so treat it as a direction rather than a coefficient. It does not belong in your arithmetic. It is only the reason not to assume a recovered call converts at zero.
Three cases, not one number
High
Measured answered-call rate
assumes both groups behave identically
Middle
Two thirds of measured
the figure to lead with
Low
One third of measured
show this one beside it, always
The same inputs at three conversion rates. The spread is the honest answer.
Before you multiply anything, spend 10 minutes trying to break your own two soft numbers. This is the lesson that stops the afternoon producing a confident figure built on a bad assumption nobody looked at twice.
Take your distinct missed-caller count and ask whether it is plausible as people, not rows. If it implies 12 new strangers a day phoning a single-doctor practice, something upstream is wrong.
Take your patient value and multiply it by your actual new patients for the month. If that product is nowhere near your actual new-patient revenue, your value figure is wrong.
Take your conversion rate and ask what it implies. A rate above 60% on first-time inbound callers is unusual and worth re-deriving before you rely on it.
Write down anything that failed a check, and fix the input rather than proceeding around it.
The second check is the one that catches most errors, because it is a closed loop: the same two numbers have to reconcile against a third you already know. If they do not, you have found a definition mismatch, usually a new-patient count that includes returning patients under a new insurer or a value that quietly includes product sales.
If your inputs cannot reproduce a number you already know, they will not produce a number you can defend.
The arithmetic is trivial and takes one line. Distinct missed callers, times conversion rate, times value per patient, equals monthly gap. Do it 3 times, at the 3 conversion rates from lesson 6.
Multiply distinct missed callers by your measured conversion rate, then by patient value. Call this the high case.
Repeat at two thirds of the conversion rate. Call this the middle case.
Repeat at one third. Call this the low case.
Multiply each by 12 for an annual view, and note that you extrapolated from one month.
Present the middle case as the headline and always show the low case beside it. A range with a stated method beats a point estimate with a hidden one, and anyone senior enough to approve spending will trust the range more precisely because it is less dramatic.
The ROI calculator runs this same arithmetic if you would rather not build the spreadsheet, but do the lessons above first. The calculator cannot tell you whether your repeat-caller ratio is 1.7 or 1.03, and that input changes the answer more than anything else on the page.
The whole afternoon
1
Export and clean
One ordinary month, inbound only, sub-10-second rows dropped.
2
Split by coverage
Staffed, rota gaps, unstaffed. Fix the rota gaps before buying anything.
3
Collapse repeats
Group by number inside 48 hours. Keep the rows-per-caller ratio.
4
Value and rate
Your own patient value, your own conversion rate, then discount it twice.
5
Range and record
Three cases, monthly and annual, on one dated page with the assumptions.
Eight lessons, four numbers, one dated page at the end.
An estimate without its assumptions is a rumour with a decimal point. The last lesson is the one that makes the previous seven durable: write the whole thing down on one page, in a form someone else can check.
Which month, and whether it was ordinary
Total inbound calls, and the count after removing sub-10-second rows
Missed calls split into staffed, gaps, and unstaffed
Rows-to-distinct-callers ratio
Patient value, and which of the two methods produced it
Measured conversion rate, and the discounted rates used
The three-case range, monthly and annual
The date you did this
The last line is not filler. This number ages. A practice that adds a location, changes its hours, starts running ads, or loses a receptionist has a different gap from the one it measured, and the dated page is what tells you when to run the afternoon again.
Six months is a reasonable re-measurement interval for a stable practice, and immediately is the right interval after any change to hours or staffing. What you are building is a baseline, and a baseline nobody dated is not a baseline.
It is an estimate with two soft inputs, and it should be described that way to anyone you show it to. The conversion rate is a proxy, and the extrapolation from one month to a year assumes twelve months that look like the one you measured. Neither assumption is unreasonable and neither is a measurement.
It is also not, on its own, a case for buying anything. The gap is one side of a comparison whose other side is what covering it costs, and that side has four components of its own, worked through in the real cost of a missed call.
What the number does is convert a recurring argument into a shared fact. Whichever way it comes out, the practice now has one page that says what the phone is costing and how that was worked out, and the next person who has an opinion about it has something to argue with other than a feeling.
One thing this number cannot price is what patients expect to be told. Pew Research Center, polling 3,488 US adults in June 2026, found 72% said it was extremely or very important that a provider tell them when AI was used in their care, and 56% wanted telling about appointment scheduling specifically [4]. Scheduling is the most tolerated use there is. It is still not a use most people want kept from them, which makes disclosure a decision about how you introduce a system rather than a line in this calculation.
It is worth saying plainly that the low case is a legitimate answer. A single-location practice with 20 missed calls a month, most of them repeats from 8 people, and a conservative patient value is looking at a gap that no product in this category can economically close. Finding that out in 3 hours is a good use of 3 hours.
The practices for whom this matters tend to look different in a specific way: the misses concentrate in the unstaffed bucket, the repeat ratio is near 1.0 because those callers only try once, and the patient value is high enough that a handful of recovered callers a month covers any plausible cost. If your page says that, the next question is what covering it would take, and that is a separate exercise with its own numbers.
What a page worth acting on looks like
Worth costing a fix
Misses concentrate in the unstaffed bucket
Repeat ratio near 1.0, callers try once and stop
Patient value high enough that a few recoveries cover the cost
Low case still clears the price of covering it
Probably leave alone
Misses concentrate in one rota gap you can just close
High repeat ratio, so few distinct people are affected
Most misses are abandoned-in-queue during staffed hours
Only the high case clears the price
The shape that distinguishes a gap worth closing from one that is not.
FAQs
Questions about this
Do it by hand. A month of on-screen call logs transcribed into a spreadsheet takes about an hour and gives you the same four numbers. What you should not do is substitute a remembered figure, because the whole value of the exercise is that the inputs are checkable by someone who disagrees with you.
Because callers who got through and callers who did not are different populations. Getting through correlates with calling during staffed hours, which correlates with the type of call. Applying your answered rate to missed calls assumes the two groups are identical. Running three cases and showing the low one is more honest than picking a single rate.
No. Lifetime value imports several years of retention assumptions into a question about one month of phone calls, which is how modest gaps turn into alarming headline numbers. Keep the horizon short. First-visit value is conservative and first-year value is realistic for practices where a consultation leads to a course of treatment.
Every six months for a stable practice, and immediately after any change to opening hours, staffing, locations, or marketing spend. The number describes the practice as it was during the month you measured. That is why the last lesson asks you to date the page rather than just file it.
Then you have saved yourself a subscription and gained a defensible answer for the next time the question comes up. A meaningful share of practices that run this find their coverage is adequate, or that the real problem is a lunchtime rota gap. Both are cheaper conclusions than the alternative and both are wins.
Builds AI front-office systems for medical and aesthetic practices. Posts here start from published sources rather than vendor claims, and every number links back to where it came from.
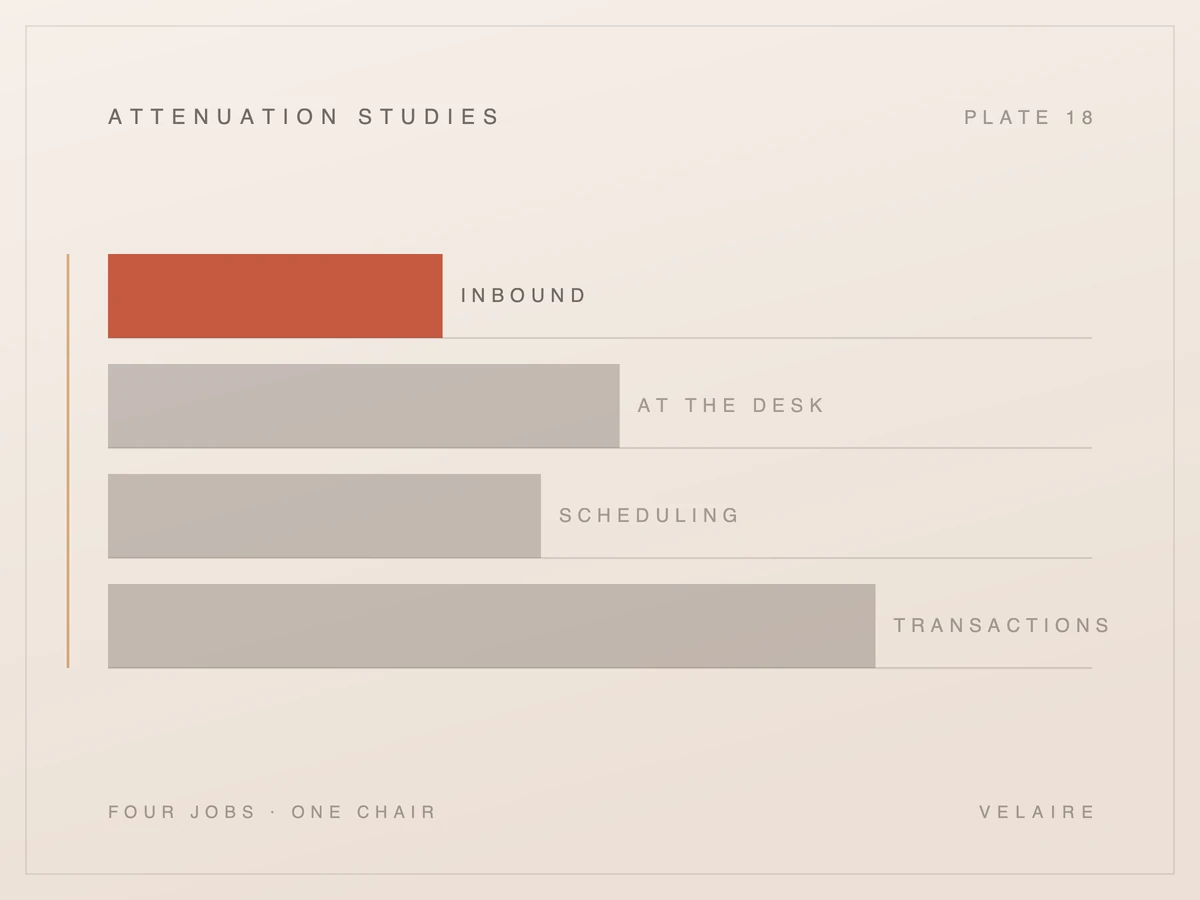
Eligibility checks, prior authorisations and claim status inquiries have measured per-transaction costs. Automating your phone does not touch any of them, and it is worth knowing that before you buy.
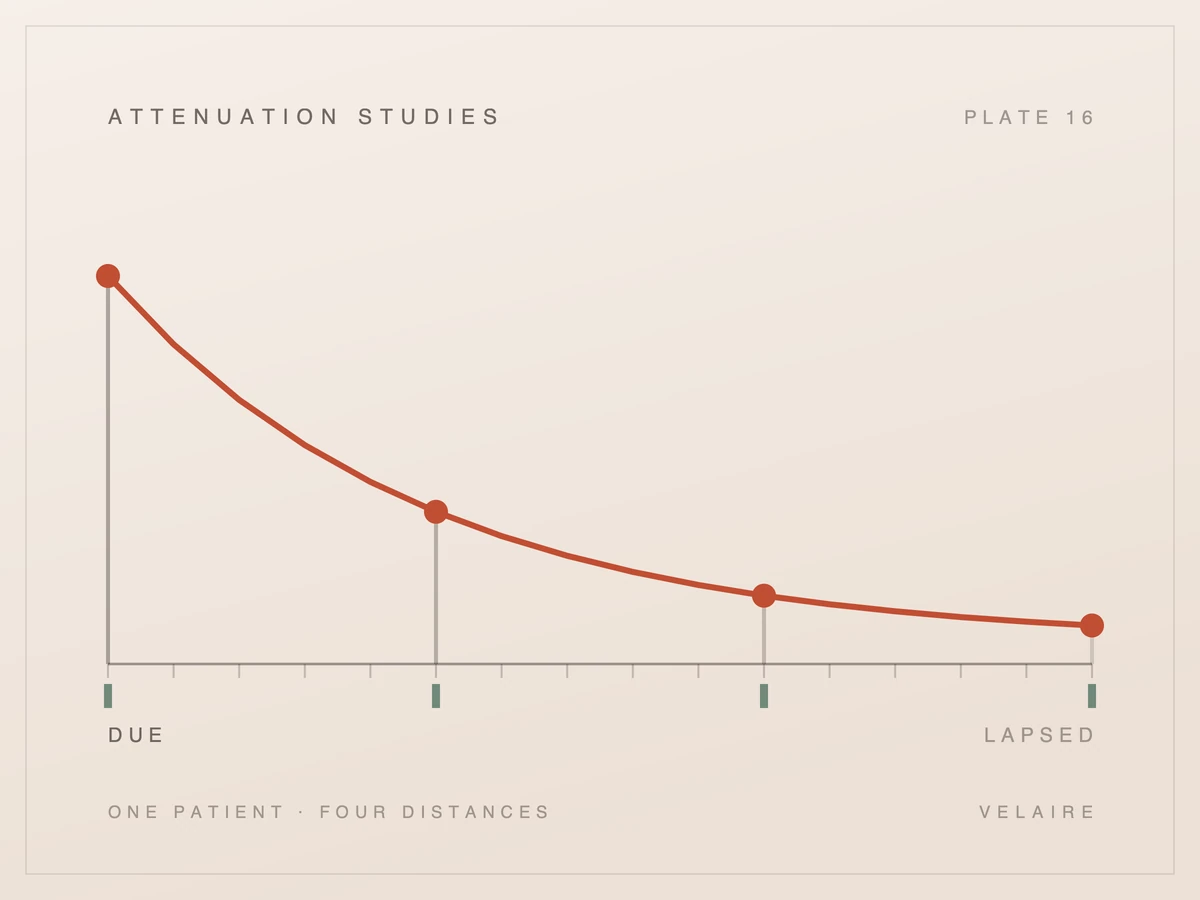
The patients most likely to book are the ones you have already treated. Here is why the contact rate is the number that matters, why recall is not marketing under HIPAA, and why the list decays quietly.
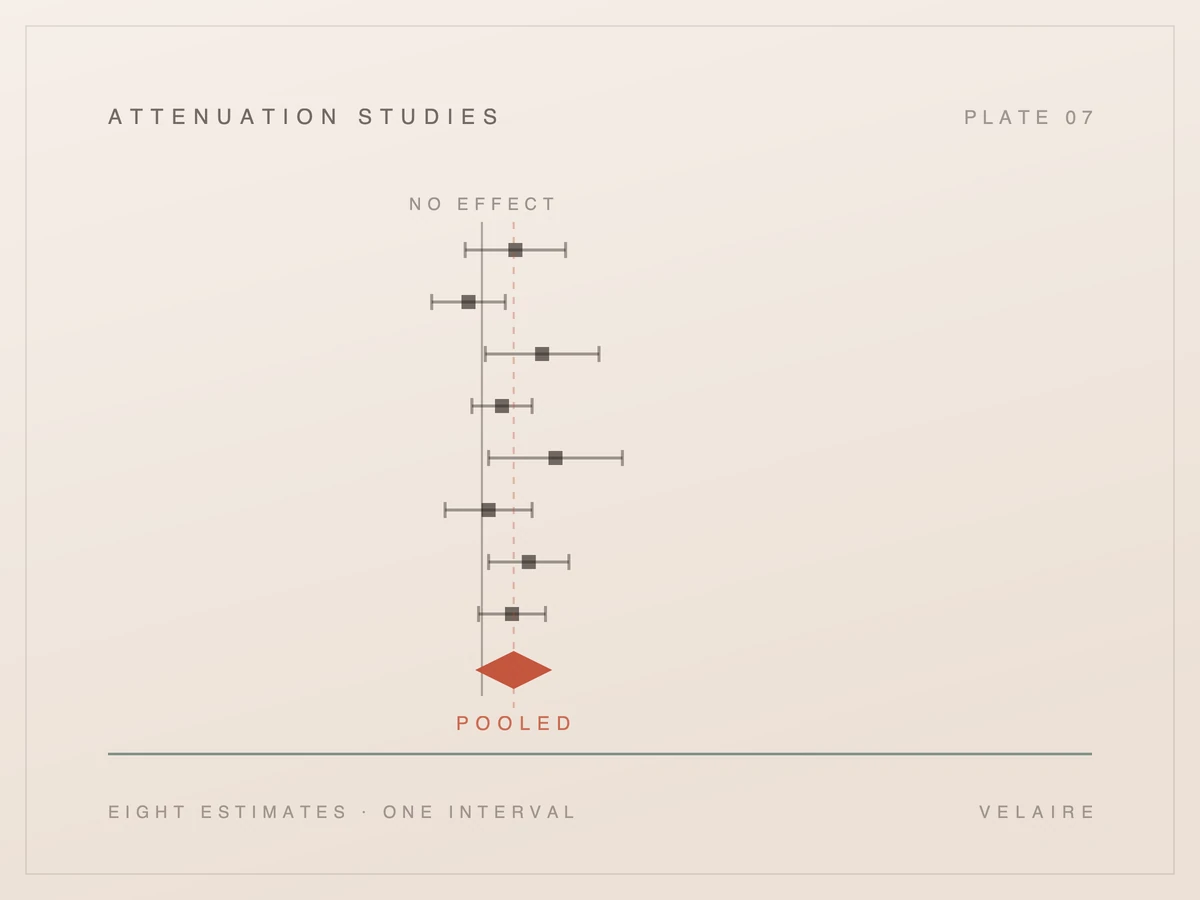
Reminders work. They work less dramatically than the marketing suggests, and the honest number is a 10.8 point improvement rather than the 14.6 point one everybody quotes. Here is what the trials found.
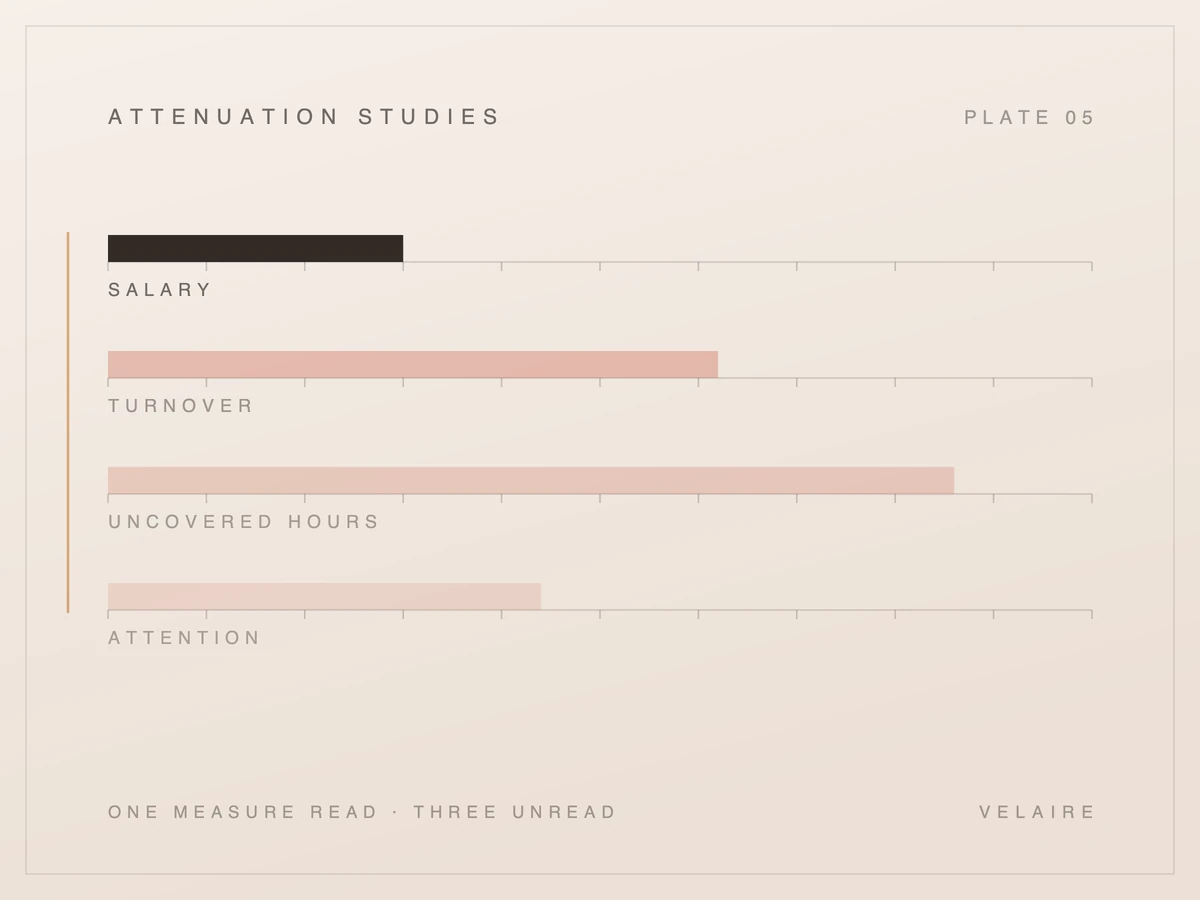
The salary is the number everyone quotes and the easiest one to find. Three others sit underneath it, and together they change what any coverage decision is really being compared against.
Skip the vendor stat sheets. Four numbers you already have will tell you what a missed call is worth to your specific practice, and whether covering them is worth paying for.
When a US practice needs a business associate agreement with an AI phone agent vendor, what the agreement must cover under HIPAA, and what to request before call data flows.
The plain-language explainer: what it does, what it deliberately doesn't, and how it compares with voicemail, an answering service, a phone tree, and hiring.